What is a fair Solar Panel Installation Cost in 2026? A Professional Engineer breaks down US pricing, the 30% tax credit, and how to spot overpriced quotes.
Every dollar of your solar investment explained — panels, labor, permits, hidden fees, the 30% federal tax credit, payback math, and what separates a fairly priced quote from an overpriced one. Written by a Registered Professional Engineer (PEC ELECTRO/15141) who has reviewed hundreds of solar proposals and seen every cost manipulation in the industry.
Let me be direct: solar pricing in the United States is confusing by design. Some of that is legitimate — costs genuinely vary by location, roof type, system size, incentive stack, and labor market. But a significant portion of the confusion exists because it benefits sellers, not buyers.
I have reviewed solar proposals for homeowners where two quotes for identical systems — same panel brand, same inverter, same system size, same roof — differed by $11,000. The cheaper one was fairly priced. The expensive one was not bad equipment; it was a larger margin layered into every line item, from the cost per watt down to the permit fee markup.
This guide breaks down every cost category in a US residential solar installation, explains what drives price variation in each one, tells you what fair market pricing looks like in 2026, and gives you the financial math to evaluate any quote you receive. By the time you finish reading, you will know more about solar pricing than most salespeople who quote you.
1. Install Solar Panels Cost: How much does it cost to install solar panels in 2026?

The national average installed cost for a residential solar system in the US in 2026 sits at roughly $2.95 per watt before incentives, according to Lawrence Berkeley National Laboratory’s Tracking the Sun dataset and SEIA Q1 2026 market data. That means:
| System Size | Gross Cost (Before ITC) | After 30% Federal ITC | Common Home Profile |
| 4 kW | $10,800–$13,600 | $7,560–$9,520 | Small home, 1–2 people, <600 kWh/mo |
| 6 kW | $16,200–$20,400 | $11,340–$14,280 | Medium home, 2–3 people, 700–900 kWh/mo |
| 8 kW | $21,600–$27,200 | $15,120–$19,040 | Larger home, 3–4 people, 1,000–1,200 kWh/mo |
| 10 kW | $27,000–$34,000 | $18,900–$23,800 | Large home or EV owner, 1,200–1,500 kWh/mo |
| 12 kW | $32,400–$40,800 | $22,680–$28,560 | High-usage home, EV + battery prep |
| 10 kW + 13.5 kWh (Lithium Ion Battery) | $35,000–$48,000 | $24,500–$33,600 | Full backup, high grid-outage risk area |
Engineer’s Note: These are installed system costs — panels, inverter, racking, wiring, permit, labor, and utility interconnection all included. The cost per watt on your quote should fall between $2.60 and $3.80 for a competitive 2026 US market. Below $2.60 raises quality questions. Above $3.80 demands justification from the installer.
2. The Anatomy of a Solar Quote: Where Every Dollar Goes
A solar installation quote is not one number — it is the sum of six distinct cost categories. Understanding each one is the only way to evaluate whether a quote is fair.
| Cost Category | % of Total System Cost | Typical Range (6 kW System) | What It Covers |
| Solar panels | 25–35% | $4,500–$7,000 | Modules themselves: brand, wattage, efficiency tier |
| Inverter(s) | 10–15% | $1,800–$3,200 | String inverter, optimizers, or microinverters |
| Racking & mounting | 5–10% | $900–$2,000 | Rails, feet, flashings, roof attachments |
| Electrical BOS | 8–12% | $1,500–$2,500 | Wiring, conduit, disconnects, rapid shutdown, meter |
| Labor | 15–25% | $2,700–$5,000 | Installation crew, electrician, inspection attendance |
| Soft costs | 15–25% | $2,700–$5,000 | Permits, design, sales, overhead, margin |
The single largest driver of price differences between competing quotes is almost always the soft costs category — not equipment. Two installers using identical panels and inverters can produce quotes $4,000 to $8,000 apart purely based on their overhead structure, customer acquisition cost, and margin expectations.
3. Solar Panel Cost: What You Are Actually Paying For
Panels account for roughly a third of your total system cost. In a 6 kW system using 20 x 300W panels or 15 x 400W panels, the module cost typically runs $4,500 to $7,000 at 2026 US wholesale and retail pricing.
Tier 1 vs. Tier 2 Panels — What It Means
“Tier 1″ is a manufacturing quality classification from Bloomberg NEF, not a performance guarantee. It means the manufacturer has a bankable financial track record and consistent production quality, which matters for warranty security over a 25-year horizon. It does not mean Tier 1 panels always outperform Tier 2.
| Panel Brand / Tier | 2026 Avg Retail (per watt) | Efficiency Range | Warranty |
| REC Alpha / Maxeon (Premium Tier 1) | $0.45–$0.65/W | 22.0–24.1% | 25yr product, 40yr linear power |
| Panasonic EverVolt HIT (Tier 1) | $0.40–$0.55/W | 21.6–23.0% | 25yr product + power |
| Qcells Q.PEAK DUO (Tier 1) | $0.32–$0.44/W | 20.4–21.4% | 25yr product + power |
| Jinko / LONGi / Trina (Tier 1) | $0.26–$0.36/W | 20.0–22.5% | 12–15yr product, 25yr power |
| Generic / unbranded (Tier 2–3) | $0.18–$0.26/W | 17.0–20.0% | Varies, often <10yr product |
Engineer’s Note: The real cost comparison is not panel price per watt — it is levelized cost of energy (LCOE) over 25 years. A $0.60/W Maxeon panel with a 0.25% annual degradation rate outperforms a $0.28/W generic panel degrading at 0.70% per year by roughly 12% cumulative production over the system’s life. Calculate total energy yield, not upfront cost per watt.
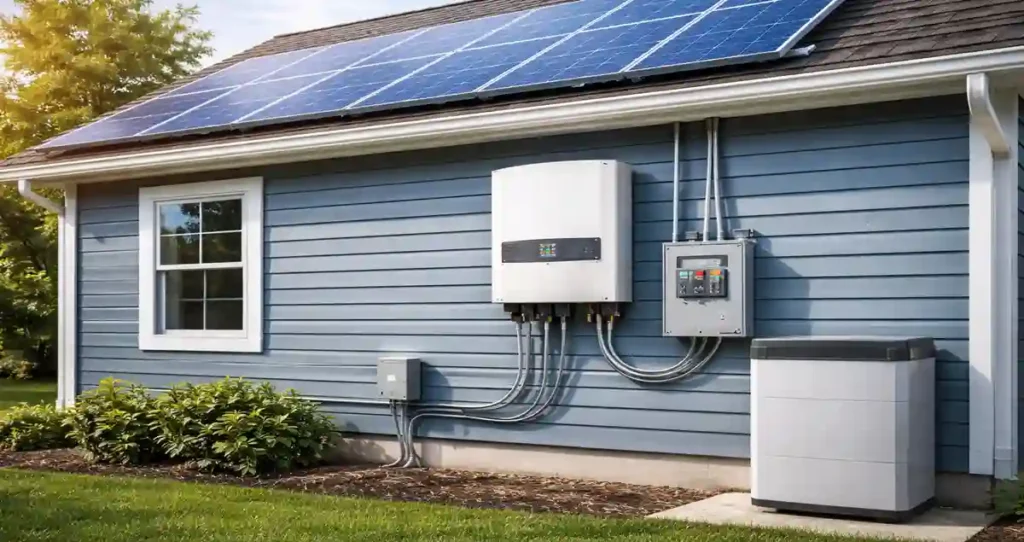
4. Inverter Cost: The Component That Determines Your Options
The inverter is frequently where homeowners inadvertently compromise system quality to hit a budget target. It is also the component most likely to need replacement during the system’s 25-year life, so the upfront cost should be weighed against lifespan and replacement cost.
| Inverter Type | Installed Cost (6 kW system) | Lifespan | Best For | Key Weakness |
| String inverter (Fronius, SMA, ABB) | $900–$1,600 | 10–15 years | Simple, unshaded south-facing roofs | Single point of failure; full system down if it fails |
| String + power optimizers (SolarEdge) | $1,600–$2,800 | Inv: 12 yrs; Opt: 25 yrs | Partial shade, panel-level monitoring | Optimizer failure affects individual panels |
| Microinverters (Enphase IQ8 series) | $2,200–$4,000 | 25 years | Complex roofs, max monitoring, resilience | Highest upfront cost |
| Hybrid Inverter/ battery-ready (SolarEdge, Sungrow) | $2,500–$4,500 | 12–15 years | Future battery add-on, backup capability | Costlier; battery still separate |
My recommendation for most US homeowners in 2026: if the roof has any shading or faces a direction other than due south, specify Enphase microinverters. The additional upfront cost — typically $600 to $1,400 more than a string system — is recovered in 3 to 5 years through better performance under partial shading and is never offset by an inverter replacement event over the system’s life.
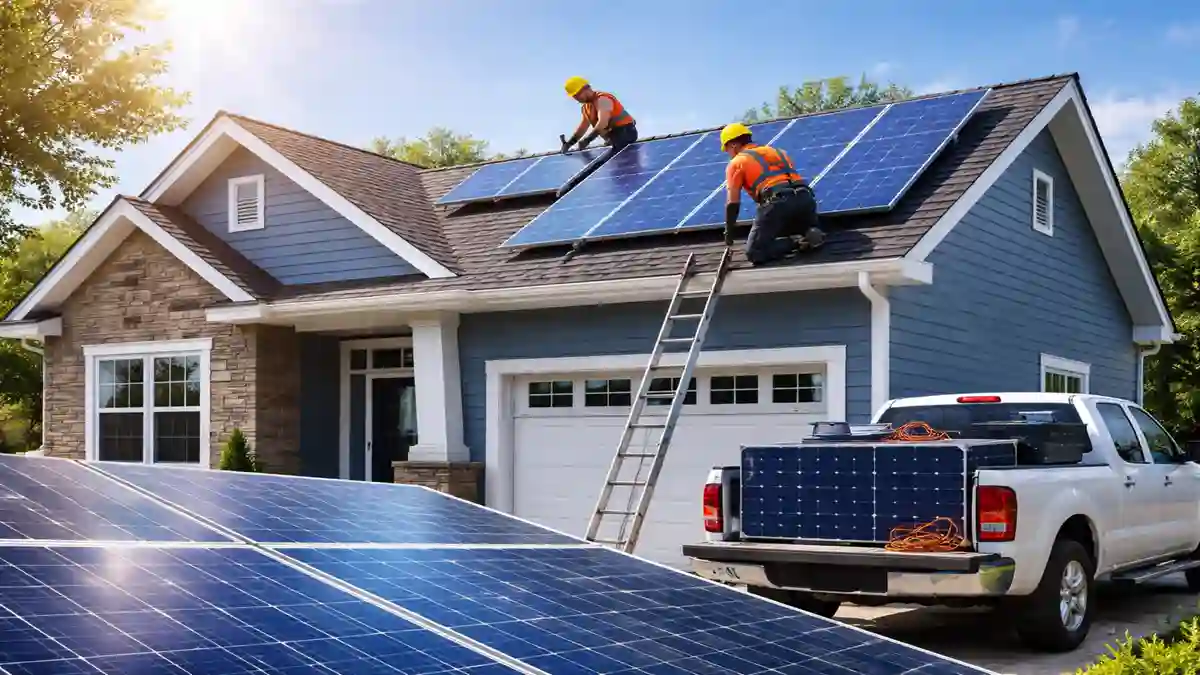
5. Labor Cost: The Most Variable Line Item
Labor is where US regional cost differences are most extreme. Solar installation labor costs are driven by local wages, crew availability, permitting complexity, and the competitiveness of the local installer market.
| Region / State | Avg Labor Cost (6–8 kW system) | Key Drivers |
| California (Bay Area, LA) | $4,500–$7,500 | High wages, complex permitting, union labor in some counties |
| Hawaii | $5,000–$8,000 | Island logistics, high demand, limited installer competition |
| New York / New Jersey | $4,000–$6,500 | High wages, complex utility interconnection process |
| Texas | $2,800–$4,500 | Competitive market, faster permitting, lower prevailing wages |
| Arizona / Nevada | $2,500–$4,000 | High volume, streamlined permitting, strong competition |
| Midwest (IL, OH, MO) | $2,500–$4,200 | Moderate wages, variable utility cooperation timelines |
| Southeast (FL, GA, SC) | $2,200–$3,800 | Lower wages, growing market, variable permitting speed |
Real Quote Observation: I reviewed a 7.2 kW quote in New Jersey with $6,800 in labor costs and another from the same area for the same system at $4,100. Both used NABCEP-certified crews. The $2,700 difference was entirely overhead and margin — not crew quality or installation complexity. Always get three quotes in your specific market.
6. Permit and Interconnection Costs: The Hidden Line Items
Permit and interconnection fees are real costs — but they are also one of the most commonly inflated items in solar proposals. Here is what these costs actually look like versus what they are sometimes quoted at.
| Fee Type | Actual Cost to Installer | What Some Quotes Show | Fair Markup |
| Building permit | $100–$500 (most jurisdictions) | $300–$900 | 15–25% admin markup is reasonable |
| Electrical permit | $75–$300 | $200–$600 | Same — admin time is real |
| Utility interconnection | $50–$300 (utility fee) | $200–$800 | Utility processing time is real overhead |
| HOA approval (if required) | $0–$200 (filing fee) | $200–$500 | Admin time only |
| Structural engineering PE | $350–$700 (older homes) | $600–$1,200 | Subcontracted cost; 20% markup is fair |
Total permit and interconnection costs for a typical residential US installation in 2026 should run $500 to $1,500. If your quote shows $2,000 to $3,500 in permit fees on a standard residential job, ask for itemization. You are likely looking at a bundled soft cost markup.
7. Hidden Costs Most Homeowners Are Not Warned About
Legitimate solar installers disclose these. Others surface them after a contract is signed. Know them in advance.
Main Panel Upgrade
If your existing electrical service panel is at or near its NEC 120% capacity limit — common in homes with 100A service or older 200A panels with few open breaker slots — a main panel upgrade (MPU) may be required to accommodate the solar interconnection. This is a legitimate and often necessary cost that should appear in your initial quote if the site assessment was done properly.
Typical cost: $1,500 to $4,500, depending on panel location, upgrade scope, and local labor rates.
Roof Repairs or Reinforcement
An honest site assessment flags roof issues before installation. A roof in poor condition that should be replaced before solar goes on it can add $5,000 to $18,000 to your project timeline if discovered after installation begins. Some installers skip this assessment to close the sale faster. Do not let them.
Always request a written roof assessment report as part of the site evaluation.
Tree Trimming or Removal
Shade from trees is one of the top causes of underperforming solar installations. If a shading analysis reveals that trees need trimming or removal for the system to perform as projected, that cost needs to be in your budget before you sign. It is not part of the solar installation cost, and most installers will not mention it.
Tree trimming: $300–$1,500. Tree removal: $800–$5,000 per tree, depending on size.
Inverter Replacement (Lifetime Cost)
String inverters have a rated lifespan of 10 to 15 years. Over a 25-year system life, you will likely replace a string inverter at least once. Budget $1,200 to $2,500 for this replacement, factoring in labor. Microinverters are rated for 25 years and carry a 25-year warranty from Enphase — their lifetime replacement cost is zero in normal conditions.
Monitoring Subscription Fees
Some installers charge ongoing monitoring fees of $10 to $20 per month. Others include it free with the inverter manufacturer’s platform (SolarEdge, Enphase, and most quality inverter brands offer free cloud monitoring). Clarify this before signing — over 25 years, a $15/month monitoring fee adds $4,500 to your total cost of ownership.
8. How the 30% Federal Investment Tax Credit Works (And What It Applies To)
The Residential Clean Energy Credit — the 30% federal ITC extended through 2032 by the Inflation Reduction Act — is the single most significant financial incentive in the US solar market. It is also one of the most misunderstood.
What the 30% ITC Covers
The credit applies to 30% of your total eligible system cost, which includes every component and service cost that is part of the solar installation:
- Solar panels
- Inverter(s), optimizers, or microinverters
- Racking, mounting hardware, and flashings
- Electrical balance of system: wiring, conduit, disconnects, rapid shutdown
- Labor costs for installation
- Permit fees and engineering fees
- Battery Energy Storage System installed simultaneously with the solar system (or added later as of 2023 IRA rules)
- Sales tax on all of the above
On a $20,000 installed system, the 30% ITC yields a $6,000 direct reduction in your federal income tax liability — not a deduction, a credit. This is dollar-for-dollar off your tax bill, not a reduction in taxable income.
Critical ITC Rules Most Homeowners Miss
- You must have sufficient federal tax liability. The credit cannot exceed your total tax owed in the year it is claimed. If your tax liability is only $3,000 but your credit is $6,000, you claim $3,000 this year and carry the remaining $3,000 forward to the next tax year.
- It must be your primary or secondary residence. Investment properties or rental properties do not qualify for the residential credit — they use the commercial ITC (also 30%, different filing).
- You must own the system. Leased solar systems do not qualify for the homeowner ITC — the leasing company takes the credit instead. This is the core financial argument against solar leases.
- The system must be new. Used or previously installed equipment does not qualify.
Engineer’s Note: File IRS Form 5695 with your federal tax return in the year the system is placed in service (i.e., when it receives Permission to Operate from your utility, not when it is physically installed). Your CPA needs the full itemized invoice — every line item — to maximize the eligible credit base.
9. State Incentives That Stack on Top of the Federal ITC
| State | Key Incentive | Value | Notes |
| California | SGIP battery rebate, NEM 3.0 net billing | $200–$1,000/kWh (batteries) | NEM 3.0 reduced export rates — battery storage now critical for CA ROI |
| New Jersey | SREC-II program + net metering | $85–$120/MWh ongoing | One of strongest SREC markets in the US; significant ongoing income |
| Massachusetts | SMART program + state tax credit | 6–16¢/kWh produced + 15% state credit | State credit capped at $1,000 |
| New York | NY-Sun incentive + state tax credit | Up to $5,000 + 25% credit (max $5,000) | Credit capped; incentive varies by utility territory |
| Texas | Property tax exemption | 100% of added home value | No state income tax = no state credit; but full property tax exemption |
| Arizona | State income tax credit | 25% of cost, max $1,000 | Plus sales tax exemption on solar equipment |
| Illinois | SREC / SHINES program | $50–$75/MWh | Program funding is variable; check current availability |
| Florida | Sales tax exemption + property tax exemption | 6% sales tax saved | No state income tax; property exemption is the primary benefit |
The most powerful state incentive structures — New Jersey, Massachusetts, New York — can reduce your effective net cost by an additional 20 to 35% on top of the federal ITC. In those markets, a well-designed 8 kW system costing $24,000 gross can have an effective out-of-pocket cost below $12,000 after all stacked incentives.
10. Payback Period and ROI: How to Calculate It Correctly
The payback period calculation I see in most sales presentations is wrong — or at minimum, oversimplified. Here is how to do it with engineering rigor.
The Correct Payback Formula
Simple Payback (years) = Net System Cost ÷ Annual Electricity Bill Savings
Where Net System Cost = Gross Installed Cost minus Federal ITC minus State Credits/Rebates minus SREC income (first year, if applicable).
And Annual Electricity Bill Savings = Annual System Production (kWh) × Your Electricity Rate ($/kWh) × Net Metering Compensation Rate.
Worked Example: 8 kW System in New Jersey, 2026
| Input | Value |
| Gross system cost | $26,400 ($3.30/W installed) |
| Federal ITC (30%) | -$7,920 |
| NJ SREC-II income (Year 1 estimate) | -$1,200 |
| Net cost after incentives | $17,280 |
| Annual system production (est.) | 9,600 kWh (8 kW × 4.5 peak sun hrs × 365 × 0.80 derate) |
| NJ average electricity rate (2026) | $0.167/kWh |
| Net metering rate (NEM full retail) | $0.167/kWh (NJ still full retail NEM) |
| Annual bill savings | $1,603 |
| Simple payback period | 10.8 years |
| 25-year net savings (excl. inflation) | $23,000 (estimated) |
| 25-year net savings (with 3% rate escalator) | $31,400 (estimated) |
That 3% electricity rate escalator matters significantly. Utility electricity rates in the US have risen at an average of 2.8% per year over the past two decades. A solar power system locks in your generation cost at zero for 25 years — the value of that hedge grows every year electricity prices rise.
Engineer’s Note: The payback periods in sales brochures almost always use the highest possible electricity rate and 100% offset assumptions. Ask your installer for the PVWatts-generated production number, your actual average electricity rate from last year’s bills, and the net metering compensation rate in your utility territory. Plug those three numbers into the formula above and recalculate yourself.
11. Solar Loan vs. Cash vs. Lease vs. PPA: Cost Comparison
How you finance your solar installation changes its total cost significantly. This is one of the least transparently discussed aspects of solar economics.
| Financing Type | ITC Benefit | 25-Year Net Cost | Pros | Cons |
| Cash purchase | Full 30% to homeowner | Lowest — $14,000–$22,000 net on 8kW after ITC | Maximum savings, full ownership, highest ROI | Large upfront capital required |
| Solar loan (5–7% APR) | Full 30% to homeowner | Moderate — interest adds $4,000–$9,000 over loan term | No upfront cost, ownership from day 1 | Interest cost reduces net ROI |
| Solar lease | Goes to leasing company | Higher long-term — lease payments continue 20–25 yrs | No upfront, no maintenance responsibility | No ITC, no equity, rate escalators, complicates home sale |
| PPA (Power Purchase Agreement) | Goes to PPA provider | Depends on rate and escalator — can be competitive | Pay per kWh only, no upfront | No ownership; escalator clauses can erode savings in later years |
My position on this: if you can access a solar loan at under 6% APR — which is available from most credit unions and several dedicated solar lenders like Mosaic, Sunlight Financial, and GreenSky — ownership beats a lease financially in almost every US market. The ITC alone is worth $6,000 to $10,000 on a typical system. Handing that to a leasing company because you want zero down is rarely the right trade-off when financing alternatives exist.
12. How to Read a Solar Quote and Spot Overpricing
Here are the specific things I look at when reviewing a solar proposal. Use this as your checklist.
Cost per Watt
Divide the total installed cost by the system size in watts. In 2026, $2.60 to $3.40/W is competitive for most US markets. $3.40 to $3.80/W may be justified in high-cost markets (Bay Area, Hawaii, NYC). Above $3.80/W requires a clear explanation — premium panel tier, complex roof, significant electrical work, or market conditions.
Equipment Specification Sheet
Any legitimate quote includes the model numbers for every piece of equipment — not just brand names. “Q Cells panels” is not a specification. “Q Cells Q.PEAK DUO ML-G10+ 400W (24 panels)” is. If your quote does not specify model numbers, ask for them before signing anything.
Production Estimate Source
Ask where the annual production number in the quote comes from. Acceptable answers: PVWatts simulation, Aurora Solar, or Helioscope — all of which use actual satellite irradiance data for your specific address. Unacceptable answer: “our standard estimate for your area.” Generic estimates systematically overstate production in shaded or non-ideal installations.
Permit Cost Line Item
If permit fees are not individually itemized — or if they appear as a single “permitting and interconnection” line above $1,500 — ask for a breakdown. Bundled permit fees are a common soft cost inflation point.
Warranty Terms
Confirm that the quote specifies the product warranty and power production warranty separately for panels, inverters, and racking. The industry standard in 2026 is 25 years on panels (both product and power), 10 to 25 years on inverters depending on type, and 10 to 25 years on racking. Anything shorter is a quality flag.
Final Thoughts: What a Fair Solar Investment Looks Like
Solar economics in the US in 2026 are genuinely good. The hardware is cheaper than it has ever been, the federal incentive is at its maximum, and electricity rates continue rising. For most homeowners in most US markets, a properly designed, competitively quoted solar system is a sound long-term financial decision.
But “sound financial decision” and “whatever the first salesperson quotes you” are not the same thing. The difference is knowledge — knowing what each cost category should be, what the incentives actually cover, and how to read a production estimate with a critical eye.
Get three quotes. Verify the equipment model numbers. Ask for the PVWatts simulation. Calculate the payback yourself using your actual electricity bill. Talk to your CPA before signing anything about ITC eligibility. And if a quote comes in at $3.90/W for standard equipment on a straightforward roof, keep shopping.
The solar industry has made extraordinary progress over the past 25 years. The best outcome for everyone is an informed homeowner who makes a great decision and has a system that performs exactly as promised for the next quarter century. That is what this guide is for.
Frequently Asked Questions
How much does solar panel installation cost for a typical US home?
For a median US home consuming 900 kWh per month, a 6 to 8 kW system is typical. The gross installed cost in 2026 runs $18,000 to $27,000. After the 30% federal ITC, the net cost is $12,600 to $18,900. With state incentives in strong solar states, effective costs can drop to $10,000 to $14,000.
Is the 30% federal tax credit still available in 2026?
Yes. The Residential Clean Energy Credit at 30% is extended through 2032 under the Inflation Reduction Act. It steps down to 26% in 2033 and 22% in 2034 before expiring for residential installations in 2035 (commercial installations retain a permanent 10% credit). Installing in 2026 captures the full 30%.
What is the average payback period for solar in the US?
In 2026, the average payback period for a US residential solar system after the federal ITC is 7 to 12 years, depending on electricity rates, system production, and local net metering policy. High-electricity-rate states like California, Hawaii, New Jersey, and Massachusetts typically see 6 to 9 year paybacks. Low-rate states with limited net metering can stretch to 11 to 14 years.
Does solar increase home value?
Yes — consistently. Lawrence Berkeley National Laboratory’s research found that homes with owned solar installations sold at a premium of approximately $4 per watt of installed capacity on average, translating to roughly $15,000 to $25,000 of added value for typical residential systems. Leased systems have a more complicated impact on home sale — buyers must either assume the lease or the seller must buy out the leasing company before closing.
What is the cost difference between string inverters and microinverters?
For a 6 to 8 kW system, microinverters (Enphase) typically add $1,000 to $2,000 to the installed cost compared to a string inverter. With power optimizers (SolarEdge), the premium over a basic string inverter is $600 to $1,400. In most installations with any degree of shading or orientation complexity, this premium is recovered within 4 to 6 years in additional production.
Should I get a solar loan or pay cash?
If you have the capital, cash purchase delivers the highest 25-year return — you capture the full federal ITC yourself and pay no interest. If financing, a solar loan at under 6% APR is financially superior to a lease or PPA in almost all cases because you retain the ITC and system ownership. Avoid leases unless you have zero options for financing — the ITC value you transfer to the leasing company typically exceeds any short-term savings from zero-down entry.
Thanks for the mention! Sizing for the Pacific Northwest (Washington/Oregon) is a great example of why national averages don’t work. The lower peak sun hours in that region mean that the Solar Savings Index relies much more on local net metering policies than just raw irradiance. Glad you found the breakdown helpful for your homeowners!