
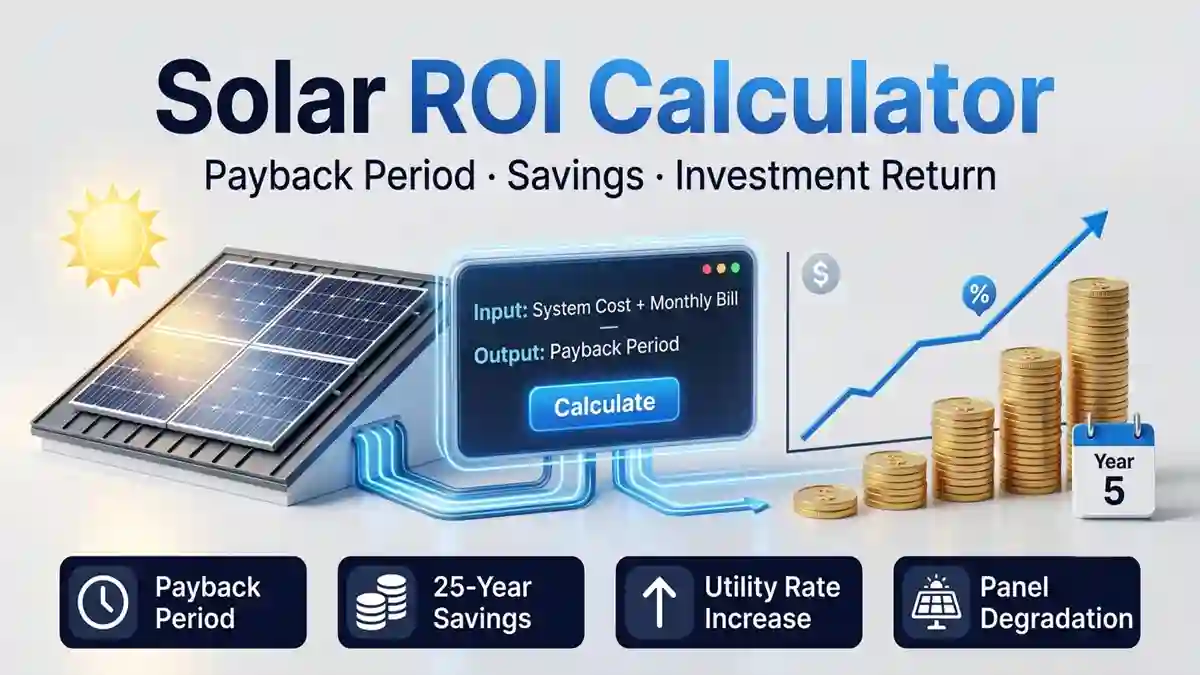
Free Solar ROI Calculator — Find your exact payback period and 25-year savings. Accounts for utility rate increases and panel degradation for accurate solar investment planning.
Please enter valid values greater than zero.
Use our free Solar ROI Calculator to find out exactly how many years it will take to recover your solar investment, and how much you will save over the full 25-year lifespan of your system. Enter your system cost, monthly electricity bill, and a few key assumptions to get an instant, engineering-grade financial projection — not just a rough estimate.
1. Why a Solar ROI Calculator Gives You a More Accurate Answer
Most online solar payback estimates use a single, oversimplified formula: system cost divided by first-year savings. This gives a rough payback number but ignores two factors that significantly change the real result over a 20-25 year system lifespan — rising utility rates and gradual panel degradation.
A proper Solar ROI Calculator must account for both. Utility rates almost never stay flat; they typically rise 3-8% per year depending on region and grid conditions. Meanwhile, solar panels lose a small percentage of their output every year due to natural degradation. A calculator that ignores both factors will either underestimate your savings (by ignoring rising utility costs) or overestimate them (by assuming your panels perform at year-one output forever).
Engineer’s Note: A simple payback calculation (Cost ÷ Year 1 Savings) is a reasonable rough estimate but consistently overstates the true payback period by 10-20% in regions with typical 4-6% annual utility inflation, because it ignores the fact that your savings actually grow each year as grid electricity prices rise. Always use a year-by-year projection model, not a single-year snapshot, when evaluating a solar investment.
2. How the Solar ROI Calculator Formula Works
Simple Payback (Years) = System Cost ÷ Annual Savings (Year 1)
Accurate Payback Model: Projects savings year by year, applying a compounding utility rate increase and a compounding panel degradation rate, then finds the exact year cumulative savings equal the system cost.
Example: System cost: $8,000 | Monthly bill: $150 | Offset: 90% | Utility inflation: 5% | Panel degradation: 0.5%
Year 1 Savings: $150 × 0.90 × 12 = $1,620 per year
Simple Payback: $8,000 ÷ $1,620 = 4.9 years
Accurate Payback (with inflation and degradation): Approximately 4.6 years, since rising utility rates offset panel degradation and accelerate the true break-even point compared to the simple calculation.
Engineer’s Note: In most regions, utility rate inflation (3-8% per year) outweighs panel degradation (0.3-0.7% per year) by a factor of 5 to 15 times. This means your solar savings almost always grow faster year over year than your panels’ output declines — which is why an accurate Solar ROI Calculator typically shows a slightly faster payback than the naive simple-division method, not a slower one.
3. Key Inputs Every Solar ROI Calculator Should Include
System Cost and Size
Total installed system cost includes panels, inverter, mounting structure, wiring, labor, and any battery storage. System size in kW determines your expected daily and annual generation, which should be cross-checked against your Solar Panel Size Calculator result to ensure the numbers are consistent.
Monthly Electricity Bill and Offset Percentage
Your current monthly bill before solar establishes the baseline savings potential. The offset percentage — how much of that bill your solar system actually covers — depends on your system size relative to your consumption, net metering policy in your region, and seasonal generation variation. A well-sized system typically offsets 80-100% of a residential bill.
Annual Utility Rate Increase
Historical utility rate inflation varies by country and grid operator, but 3-8% annual increases are common globally as of 2026 due to rising fuel costs, grid infrastructure investment, and inflation. Using a conservative 3-5% assumption in your Solar ROI Calculator gives a realistic, defensible savings projection without overstating results.
Panel Degradation Rate
Modern monocrystalline panels typically degrade 0.3-0.5% per year, meaning a panel rated at 400W in year one produces approximately 398W in year two, and roughly 380W by year 25. Premium Tier-1 panels with strong manufacturer warranties often guarantee 85-90% of original output at year 25.
Engineer’s Note: Always request the manufacturer’s linear performance warranty document before finalizing your ROI assumptions. Reputable panel manufacturers guarantee specific output percentages at year 1, year 10, and year 25 — typically 98%, 91%, and 84% respectively for standard monocrystalline panels. Use these guaranteed figures rather than optimistic marketing claims when running your Solar ROI Calculator projection.
4. Solar ROI Calculator Examples by System Size
Small Residential System
System cost: $6,000 | Size: 3 kW | Monthly bill: $100 | Offset: 85%
Result: Annual savings Year 1: $1,020 | Simple payback: 5.9 years | 25-year total savings: approximately $38,000
Medium Residential System
System cost: $12,000 | Size: 6 kW | Monthly bill: $200 | Offset: 90%
Result: Annual savings Year 1: $2,160 | Simple payback: 5.6 years | 25-year total savings: approximately $81,000
Large Residential / Small Commercial System
System cost: $25,000 | Size: 12 kW | Monthly bill: $400 | Offset: 95%
Result: Annual savings Year 1: $4,560 | Simple payback: 5.5 years | 25-year total savings: approximately $171,000
Off-Grid System with Battery Storage
System cost: $35,000 (includes battery bank) | Size: 10 kW | Monthly bill equivalent: $350 | Offset: 100%
Result: Annual savings Year 1: $4,200 | Simple payback: 8.3 years | 25-year total savings: approximately $158,000
Engineer’s Note: Off-grid systems with battery storage always show a longer payback period than grid-tied systems of similar generation capacity, because battery costs add significantly to upfront investment without directly increasing energy generation. However, off-grid systems provide value beyond pure financial ROI — including complete independence from grid outages and load shedding, which is difficult to quantify in a pure payback calculation but matters greatly in regions with unreliable grid supply.
5. Quick Reference Solar ROI Calculator Table
| System Cost | Monthly Bill | Offset | Simple Payback | 25-Yr Savings |
| $5,000 | $80 | 80% | 6.5 yrs | $29,000 |
| $8,000 | $150 | 90% | 4.9 yrs | $56,000 |
| $12,000 | $200 | 90% | 5.6 yrs | $81,000 |
| $18,000 | $300 | 95% | 5.3 yrs | $128,000 |
| $25,000 | $400 | 95% | 5.5 yrs | $171,000 |
| $35,000 | $500 | 100% | 5.8 yrs | $215,000 |
6. Common Mistakes When Using a Solar ROI Calculator
- Using Year 1 Savings Only: A simple payback calculation ignores rising utility rates, which almost always accelerates your real payback compared to the naive estimate.
- Ignoring Maintenance and Inverter Replacement: Most string inverters require replacement once during a 25-year system life, typically costing 10-15% of original system cost around year 12-15. Include this in long-term projections.
- Overestimating Offset Percentage: A system that theoretically covers 100% of annual consumption rarely offsets 100% of the bill due to seasonal variation, net metering policy limits, and fixed grid connection charges that remain regardless of generation.
- Ignoring Financing Costs: If the system is financed rather than paid upfront, loan interest reduces net savings and extends the true payback period. Always run the ROI calculation on the total financed cost, not just the cash price.
- Using Optimistic Degradation Assumptions: Marketing materials sometimes cite best-case degradation rates. Use the manufacturer’s guaranteed warranty figures, which are typically more conservative and more reliable for financial planning.
Engineer’s Note: Government incentives, tax credits, and net metering policies can dramatically shorten the effective payback period calculated by a Solar ROI Calculator. These programs vary significantly by country and even by region within a country, and many have expiration dates or capacity limits. Always check current local incentive programs before finalizing your investment decision, since a genuine tax credit or rebate can reduce net system cost by 20-30% or more in some jurisdictions.
7. Frequently Asked Questions About Solar Payback
What is a good payback period for a solar system?
A payback period of 4-7 years is considered excellent for a residential solar system in most markets as of 2026. Payback periods of 7-10 years are still reasonable given a 25-year system lifespan, meaning 15-18 years of pure savings after the system pays for itself.
Does a Solar ROI Calculator account for battery storage costs?
Yes, if you include your total system cost including batteries in the calculation. Battery storage significantly increases upfront cost without proportionally increasing generation, so systems with battery storage typically show a longer payback period than grid-tied systems without storage, even though they provide backup power value.
How accurate is a 25-year solar savings projection?
A 25-year projection is inherently an estimate, since utility rates, panel performance, and your own electricity consumption can all change over that period. However, using manufacturer-guaranteed degradation rates and conservative, historically-grounded utility inflation assumptions (typically 3-5% per year) produces a projection that is directionally reliable and useful for investment decision-making, even if the exact final number will vary.
Should I include tax credits and rebates in my ROI calculation?
Yes. Enter your net system cost after any applicable tax credits, rebates, or incentives, not the gross pre-incentive price. This gives you the true out-of-pocket investment and the most accurate payback period. Check your local and national solar incentive programs, as many significantly improve the calculated ROI.
How does panel degradation affect my long-term solar savings?
Panel degradation reduces annual generation by a small, compounding percentage each year, typically 0.3-0.7% depending on panel quality. Over 25 years, this results in cumulative output of roughly 85-92% of the original rated capacity in the final year. This effect is real but small compared to the impact of rising utility rates, which is why solar savings still generally increase year over year despite gradual panel degradation.
Also Check Our Related Calculators
- Watt-Hours to Watts Calculator
- Watts to Watt-Hours Calculator
- kWh to kW Calculator
- kW to HP Calculator
- Amps to Watts Calculator
- Solar Battery Size Calculator
- Solar Panel Size Calculator
- Watts to Amps Calculator
- Volts to Watts Calculator
Related guides on SolarVisionAI.com
- Solar Fence Post Lights: Cap Sizes, Types & Install Guide
- Solar Charge Controller: The Complete Guide
- MC4 Connectors: Solar Safety & Installation Guide
- Solar Panel Types, Efficiency & Benefits
- Solar Water Pump Guide
- Commercial Solar Panel Installation: Engineering Guide
- Solar Fence Post Lights: Cap Sizes, Types & Install Guide — solarvisionai.com/solar-fence-post-lights/
- BESS — Battery Energy Storage System Guide — solarvisionai.com/bess-battery-energy-storage-system-guide/
- Commercial Solar Panel Installation — solarvisionai.com/commercial-solar-panel-installation/