
Solar panel degradation rate explained by a registered engineer — real year-by-year output decline data across every major cell technology.
Every solar panel produces slightly less power in year two than year one, and slightly less again in year three, in a slow, predictable decline that continues across the system’s entire operating life. This isn’t a defect — it’s simply how photovoltaic materials age under continuous outdoor exposure — but understanding the real numbers behind that decline is essential for accurately projecting a system’s total lifetime energy production and value.
This guide is part of our Solar Panel Efficiency 2026 hub, and connects to our LID vs LeTID guide for the specific early-life degradation mechanisms that add to this baseline annual decline.
What Drives Long-Term Degradation
Degradation results from a combination of factors accumulating over decades of outdoor exposure: UV exposure gradually affecting encapsulant material, minor moisture ingress despite quality sealing, thermal cycling stress from daily and seasonal temperature swings, and slow oxidation of cell material and metal contacts. None of these are preventable entirely — they’re the physical cost of operating outdoors continuously for a quarter century — but their rate varies meaningfully by cell technology and manufacturing quality.
Thermal cycling caused by daily and seasonal temperature swings is one of the primary drivers of long-term Solar Panel Degradation. For a deeper explanation of how heat affects photovoltaic performance, see our Solar Panel Temperature Coefficient guide.
How Solar Panel Degradation Compounds Over Time
A Solar Panel Degradation rate of 0.5% may appear insignificant in a single year, but the effect compounds across decades of operation. A panel retaining 99.5% of its previous year’s output will retain roughly 88% of its original capacity after 25 years, while a panel degrading at 0.7% annually retains closer to 84%. That difference may seem modest, but over a full system lifetime it can translate into thousands of additional kilowatt-hours of electricity.
Engineer’s Note: Manufacturers typically specify degradation in two figures: a somewhat larger first-year decline (often called “initial degradation,” partly related to LID effects covered in our dedicated guide), followed by a smaller, steady annual rate for the remaining panel life. Reading both figures on a warranty document, not just the headline annual percentage, gives a more accurate picture of expected 25-year output.
Typical Degradation Rates by Cell Technology
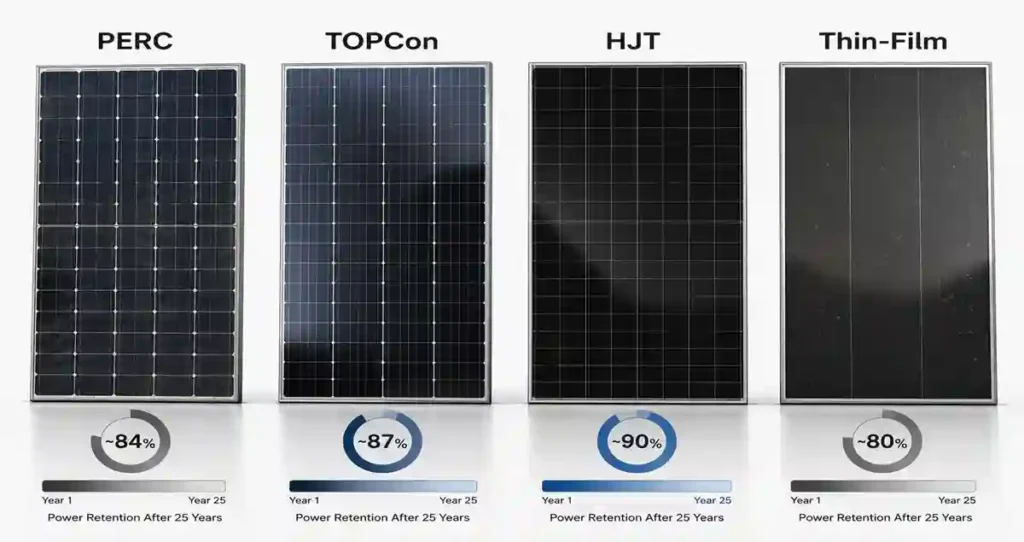
| Cell Technology | Typical First-Year Degradation | Typical Annual Rate (Years 2-25) | Industry Reference |
| Standard PERC (P-type) | ~2% | ~0.5% – 0.7%/year | Fraunhofer ISE |
| TOPCon (N-type) | ~1% or less | ~0.4%/year | Fraunhofer ISE |
| HJT | ~1% or less | ~0.25% – 0.4%/year | Fraunhofer ISE |
| Thin-Film | Variable, often higher initial | ~0.5% – 0.8%/year | NREL |
Over a full 25-year system life, these differences compound meaningfully — a panel with 0.5% annual degradation retains roughly 87-88% of its original output by year 25, while one at 0.7% annual degradation retains closer to 83-84%. That gap directly affects total lifetime energy yield and, by extension, the system’s total value delivered.
Note: These figures represent typical industry ranges rather than fixed specifications for every module. Actual Solar Panel Degradation depends on cell technology, manufacturing quality, materials, environmental conditions, and the manufacturer’s performance warranty. Always verify degradation figures using the specific module datasheet.
Advantages and Disadvantages of Prioritizing Low Degradation
| Advantages | Disadvantages |
| Meaningfully more total energy yield over a full 25-year system life | Panels with the lowest degradation rates often carry a cost premium |
| More accurate long-term ROI projections when comparing panel options | The difference is subtle year-to-year, only compounding meaningfully over decades |
| Better resale/property value signal for long-term homeowners | Requires reading warranty fine print rather than just the headline efficiency number |
Real-World Applications
I model degradation explicitly for every client evaluating panel options on cost-per-kilowatt-hour-over-system-life terms, rather than just comparing sticker price or year-one output. A panel with a modest price premium but meaningfully better degradation rate frequently wins that comparison once the full 25-year picture is calculated, even though it looks like the more expensive option on day one.
Field Note: A client comparing two competing quotes was initially drawn to the lower-priced option purely on upfront cost. Once we modeled total 25-year output accounting for each panel’s stated degradation rate, the higher-priced option’s better degradation profile closed most of the gap in total value delivered — a comparison the client wouldn’t have made without explicitly asking for the degradation figures from both suppliers.
Common Misconceptions Worth Clearing Up
People sometimes assume degradation means a panel will eventually stop working or become unsafe. It doesn’t — degradation is a gradual decline in output percentage, not a failure mode. A panel with a 25-year warranty guaranteeing 80-85% of original output at year 25 will still be reliably generating meaningful power at that point, just somewhat less than it did when new.
Buying Checklist
- Request both first-year and annual degradation figures, not just the headline efficiency number
- Compare warranty guarantees at year 25 specifically (often stated as a percentage of original output)
- Model total lifetime energy yield, not just year-one output, when comparing competing quotes
- Confirm degradation figures come from independent testing where possible, not manufacturer marketing claims alone
For the specific early-life degradation mechanisms adding to this baseline, see our LID vs LeTID guide. For the complete efficiency picture, see Solar Panel Efficiency 2026.
Why Warranty Terms Matter as Much as the Stated Rate
A manufacturer’s stated degradation rate is only as meaningful as the warranty backing it. I always check whether the degradation figure is a marketing claim in a brochure or a formal guarantee written into the product warranty, since only the latter provides real recourse if actual field performance falls short. A warranty specifying guaranteed output at year 10, year 15, and year 25 gives buyers concrete checkpoints to hold a manufacturer accountable to, rather than a single vague annual percentage.
I also recommend checking whether the warranty degradation guarantee is linear (a steady percentage each year) or stepped (a larger initial drop followed by a flatter rate), since this affects how to interpret mid-warranty performance checks. Most modern panels use a stepped structure reflecting the LID-related first-year drop covered in our dedicated guide, followed by a flatter ongoing rate.
Frequently Asked Questions
How much do solar panels degrade over 25 years?
Typically 12-18% total output decline over 25 years depending on cell technology, meaning a panel retains roughly 82-88% of its original rated output at the end of a standard 25-year warranty period.
Do all solar panels degrade at the same rate?
No — degradation rate varies meaningfully by cell technology. N-type panels (TOPCon, HJT) generally degrade more slowly than standard P-type PERC panels, primarily due to the absence of boron-oxygen light-induced degradation in N-type silicon.
Does degradation mean my solar panels will stop working eventually?
No. Degradation is a gradual, predictable decline in output percentage over decades, not a failure mode. Panels remain functional and continue generating meaningful power throughout and beyond a standard 25-year warranty period, just at somewhat reduced output compared to when new. Many panels continue producing useful power well past their formal warranty period, simply at further reduced capacity.
What is considered a good Solar Panel Degradation rate?
Modern premium modules commonly advertise annual degradation rates between 0.3% and 0.5%. Lower degradation rates generally indicate better long-term power retention, although buyers should always verify the manufacturer’s warranty rather than relying solely on marketing claims.
Which solar panel technology has the lowest degradation?
Modern N-type technologies such as TOPCon and HJT generally demonstrate lower Solar Panel Degradation than conventional P-type PERC modules. However, actual degradation depends on the specific manufacturer and module design.
Does higher efficiency mean lower degradation?
Not necessarily. Efficiency and degradation are separate specifications. A panel can achieve high laboratory efficiency while exhibiting a less favorable long-term degradation profile.
Is Solar Panel Degradation covered under warranty?
Yes. Most manufacturers provide a performance warranty that guarantees a minimum percentage of the panel’s original output after 25 or 30 years. Buyers should review the actual warranty documentation rather than relying exclusively on advertised degradation rates.
Does climate affect Solar Panel Degradation?
Yes. High temperatures, humidity, ultraviolet exposure, thermal cycling, and environmental conditions can all influence long-term module aging and degradation.
References
Degradation rate data by cell technology is drawn from Fraunhofer ISE’s Photovoltaics Report and NREL’s long-term panel performance research.
The Full Efficiency Cluster — What Each Guide Covers
- 7 Factors That Kill Solar Panel Efficiency — the complete roundup of real-world efficiency losses
- Solar Panel Temperature Coefficient — including hot-climate performance specifically
- Solar Panel Degradation Rate — how output declines year over year across a 25-year system life
- LID vs LeTID in Solar Panels — two specific early-life degradation mechanisms explained
- STC vs NOCT Solar Panel Ratings — the two standardized test conditions behind every datasheet number
- Solar Panel Efficiency in 2026: What Actually Matters?
Related guides on SolarVisionAI.com
- Monocrystalline Solar Panels 2026: Still Worth It or Hype
- Polycrystalline Solar Panels: Worth Buying in 2026?
- Thin-film Solar Panels: When They Beat Silicon (2026)
- BIPV Solar Panels: Building-Integrated PV Complete Guide
- Portable Solar Panels: Engineer’s Buyer’s Guide 2026
- CPV Solar Panels: Concentrated Photovoltaic Explained
- Skin Solar Panel: What “Solar Skin” Actually Means
- Solar Fence Post Lights: Cap Sizes, Types & Install Guide
- Bifacial Solar Panels in 2026: How to Boost Energy Output
- Solar Charge Controller: The Complete Guide
- MC4 Connectors: Solar Safety & Installation Guide
- Solar Panel Types, Efficiency & Benefits
- Solar Water Pump Guide
- Commercial Solar Panel Installation: Engineering Guide
- Solar Fence Post Lights: Cap Sizes, Types & Install Guide
- BESS — Battery Energy Storage System Guide
- Commercial Solar Panel Installation
- Solar Refrigerator & DC Fridge — Complete 2026 Guide
- Bifacial Solar Panel Albedo Effect Guide
- TOPCon: Why TOPCon Solar Panel is a Proven Smart Investment in 2026
- HJT: Why TOPCon Solar Panel is a Proven Smart Investment in 2026
- PERC: PERC Solar Panel: Still Relevant or Already Outdated?
- Perovskite: Perovskite Solar Panels: The 2026 Reality Check
- N-Type vs P-Type: N-Type vs P-Type Solar Panels: Honest Comparison
- ABC: ABC (all back contact) Solar Panel: Back Contact Technology Explained
- IBC: IBC Solar Panels: Interdigitated Back Contact Guide
- Tandem: Tandem Solar Panels: Are Stacked Cells Ready for Rooftops?